5. Visualizing the results with the OMNeT++ IDE
PREV: 4. Adding statistics collection UP: Contents
Visualizing output scalars and vectors
The OMNeT++ IDE can help you to analyze your results. It supports filtering, processing and displaying vector and scalar data, and can display histograms too. The following diagrams have been created with the Result Analysis tool of the IDE.
- Note:
- For further information about the charting and processing capabilities, please refer to the OMNeT++ Users Guide.
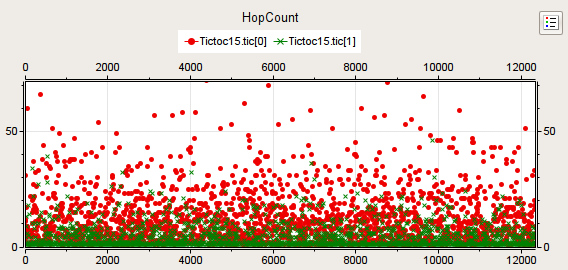
Our last model records the hopCount of a message each time the message reaches its destination. The following plot shows these vectors for nodes 0 and 1.
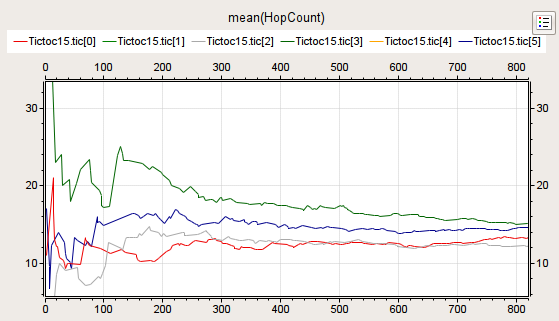
If we apply a mean operation we can see how the hopCount in the different nodes converge to an average:
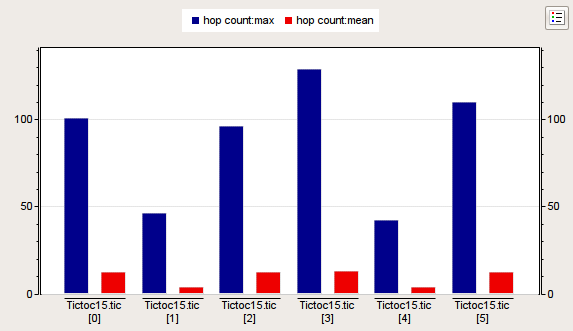
The next chart displays the mean and the maximum of the hopCount of the messages for each destination node, based on the scalar data recorded at the end of the simulation.
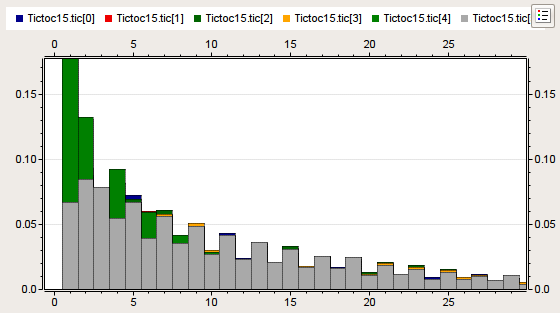
The following diagram shows the histogram of hopCount's distribution.
Sequence charts end event logs
The OMNeT++ simulation kernel can record the message exchanges during the simulation into an event log file. This log file can be analyzed later with the Sequence Chart tool.
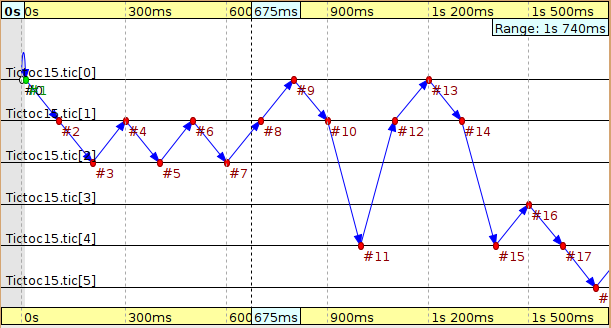
The following figure has been created with the Sequence Chart tool, and shows how the message is routed between the different nodes in the network. In this instance the chart is very simple, but when you have a complex model, sequence charts can be very valuable in debugging, exploring or documenting the model's behaviour.
Conclusion
Hope you have found this tutorial a useful introduction into OMNeT++. Comments and suggestions will be appreciated.
UP: Contents