 This documentation is released under the Creative Commons license
This module visualizes routes in the routing tables on a 3D osg scene. It displays an arrow for each route in the routing tables of the network. The arrow points from the node containing the routing table towards the gateway. The arrow automatically follows the movement of mobile nodes.
See also: RoutingTableCanvasVisualizer, RoutingTableVisualizer, RoutingTableVisualizerBase, IRoutingTableVisualizer

The following diagram shows usage relationships between types. Unresolved types are missing from the diagram.
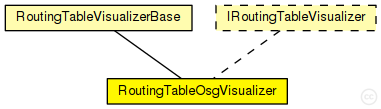
The following diagram shows inheritance relationships for this type. Unresolved types are missing from the diagram.
| Name | Type | Description |
|---|---|---|
| RoutingTableVisualizerBase | simple module |
This is a base module for routing table visualizer simple modules. It displays routes in the routing tables of the network. Routes present are not displayed by default, see the module parameters for how to enable the visualization. The actual visualization of routes is done in derived modules. |
| Name | Type | Default value | Description |
|---|---|---|---|
| visualizerTargetModule | string | " |
module path relative to the visualizer where the visualization should appear in the user interface, root module by default |
| tags | string | "" |
tag added to each visualization for disambiguation in the runtime environment |
| subscriptionModule | string | " |
module where the visualizer subscribes for routing table signals, root module by default |
| displayRoutingTables | bool | false |
display routing table data, disabled by default |
| displayRoutesIndividually | bool | true |
display routes between the same network nodes individually, enabled by default |
| displayLabels | bool | true |
display labels on arrows, enabled by default |
| destinationFilter | string | "*" |
which destinations are considered, matches all destinations by default |
| nodeFilter | string | "*" |
which nodes are considered, matches all nodes by default |
| lineColor | string | "black" |
route line color, black by default |
| lineStyle | string | "solid" |
route line style (solid, dashed, dotted) |
| lineWidth | double | 2 |
route line width |
| lineShift | double | 16 |
line shift to avoid overlapping lines |
| lineShiftMode | string | "normal" |
determines how overlapping lines are shifted, possible values are: none, normal, x, y, z; optional prefix + or - |
| lineContactSpacing | double | 3 |
spacing between arrow end and submodule icon |
| lineContactMode | string | "rectangular" |
determines how arrows are clipped at the submodules |
| labelFormat | string | "%d/%m -> %g (%n)" |
determines what route data is displayed |
| labelFont | string | " |
label font, automatic by default |
| labelColor | string | "black" |
label color, black by default |
| Name | Value | Description |
|---|---|---|
| class | RoutingTableOsgVisualizer | |
| display | i=block/app_s |
//
// This module visualizes routes in the routing tables on a 3D osg scene. It
// displays an arrow for each route in the routing tables of the network. The
// arrow points from the node containing the routing table towards the gateway.
// The arrow automatically follows the movement of mobile nodes.
//
// @see ~RoutingTableCanvasVisualizer, ~RoutingTableVisualizer, ~RoutingTableVisualizerBase, ~IRoutingTableVisualizer
//
simple RoutingTableOsgVisualizer extends RoutingTableVisualizerBase like IRoutingTableVisualizer
{
    parameters:
        @class(RoutingTableOsgVisualizer);
}
This documentation is released under the Creative Commons license