 This documentation is released under the Creative Commons license
This module visualizes statistics on a 2D canvas. See the base module for how to configure which statistic is displayed. If configured properly, then it displays the last value of the statistic to the right of the visualization of the corresponding network node. The value and the unit is wrapped in a filled white rectangle.
See also: StatisticOsgVisualizer, StatisticVisualizer, StatisticVisualizerBase, IStatisticVisualizer
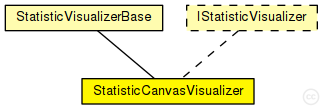
The following diagram shows usage relationships between types. Unresolved types are missing from the diagram.
The following diagram shows inheritance relationships for this type. Unresolved types are missing from the diagram.
| Name | Type | Description |
|---|---|---|
| StatisticVisualizerBase | simple module |
This is a base module for statistic visualizer simple modules. It keeps track of the last value of a statistic for multiple network nodes. The actual visualization of statistic values is done in derived modules. It subscribes for the signal determined by the signalName parameter at the module specified by the subscriptionModule parameter. If the visualizer receives such a signal it checks if the source matches the sourceFilter parameter. If the signal passes the check it determines the last value of the statistic specified by the statisticName parameter. |
| Name | Type | Default value | Description |
|---|---|---|---|
| visualizerTargetModule | string | " |
module path relative to the visualizer where the visualization should appear in the user interface, root module by default |
| tags | string | "" |
tag added to each visualization for disambiguation in the runtime environment |
| networkNodeVisualizerModule | string | "^.networkNodeVisualizer" |
the network node visualizer module, refers to a sibling submodule by default |
| subscriptionModule | string | " |
module where the visualizer subscribes for the signal, root module by default |
| displayStatistics | bool | true | |
| signalName | string | "" |
signal name to subscribe, no signal name by default |
| statisticName | string | signalName |
statistic name to get the value, signal name by default |
| sourceFilter | string | "**" |
pattern that must match the signal source, no source filter by default |
| format | string | "%n: %v %u" |
determines what is displayed, info by default |
| unit | string | "" |
display the value in this unit, statistic unit by default |
| font | string | " |
statistic value font, automatic by default |
| textColor | string | "black" |
statistic value font color, black by default |
| backgroundColor | string | "white" |
statistic value background color, white by default |
| opacity | double | 1.0 |
opacity of the visualization |
| displacementHint | string | "top" |
annotation displacement hint, space separated list of any, top, bottom, left, right, topLeft, topCenter, topRight, etc. |
| displacementPriority | double | 0 |
determines the order of annotation positioning |
| zIndex | double | 10 |
determines the drawing order of figures relative to other visualizers |
| Name | Value | Description |
|---|---|---|
| class | StatisticCanvasVisualizer | |
| display | i=block/app_s |
//
// This module visualizes statistics on a 2D canvas. See the base module for
// how to configure which statistic is displayed. If configured properly, then
// it displays the last value of the statistic to the right of the visualization
// of the corresponding network node. The value and the unit is wrapped in a
// filled white rectangle.
//
// @see ~StatisticOsgVisualizer, ~StatisticVisualizer, ~StatisticVisualizerBase, ~IStatisticVisualizer
//
simple StatisticCanvasVisualizer extends StatisticVisualizerBase like IStatisticVisualizer
{
    parameters:
        double zIndex = default(10); // determines the drawing order of figures relative to other visualizers
        @class(StatisticCanvasVisualizer);
}
This documentation is released under the Creative Commons license