 This documentation is released under the Creative Commons license
(no description)
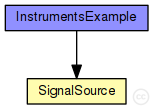
The following diagram shows usage relationships between types. Unresolved types are missing from the diagram.
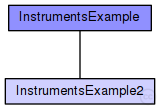
The following diagram shows inheritance relationships for this type. Unresolved types are missing from the diagram.
| Name | Type | Description |
|---|---|---|
| InstrumentsExample2 | network | (no description) |
| Name | Value | Description |
|---|---|---|
| isNetwork | ||
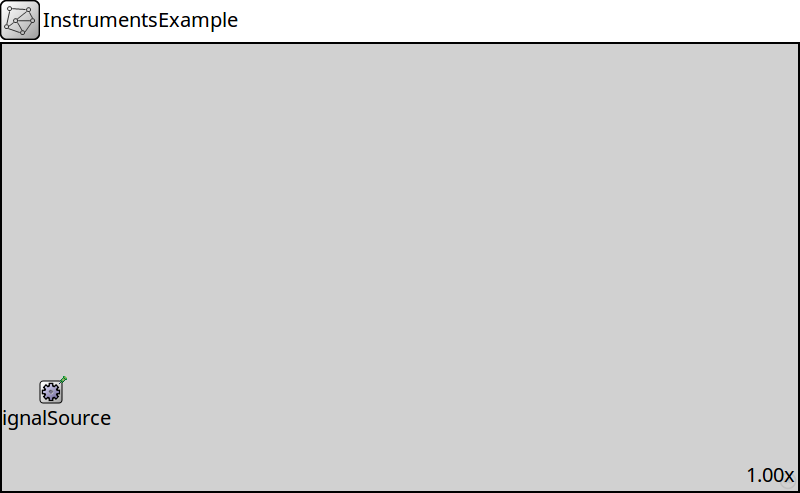
| display | bgb=800,450 |
| Name | Title | Source | Record | Unit | Interpolation Mode |
|---|---|---|---|---|---|
| gauge | signalSourceOutput | figure | |||
| image | signalSourceOutput | figure | |||
| lineargauge | signalSourceOutput | figure | |||
| plot | signalSourceOutput | figure | |||
| progress | signalSourceOutput | figure | |||
| text | signalSourceOutput | figure | |||
| label | signalSourceOutput | figure | |||
| counter | signalSourceOutput | figure | |||
| thermometer | signalSourceOutput | figure |
| Name | Type | Default value | Description |
|---|---|---|---|
| signalSource.startTime | double | 0s | |
| signalSource.endTime | double | -1s | |
| signalSource.interval | double | 1s | |
| signalSource.value | double |
network InstrumentsExample
{
    parameters:
        @display("bgb=800,450");

        @figure[text](type=indicatorText; pos=20,50; anchor=w);
        @statistic[text](source=signalSourceOutput; record=figure; targetFigure=text);

        @figure[label](type=indicatorLabel; pos=20,80; anchor=w);
        @statistic[label](source=signalSourceOutput; record=figure; targetFigure=label);

        @figure[gauge](type=gauge; pos=50,100; size=150,150);
        @statistic[gauge](source=signalSourceOutput; record=figure; targetFigure=gauge);

        @figure[lineargauge](type=linearGauge; pos=300,50; size=300,50);
        @statistic[lineargauge](source=signalSourceOutput; record=figure; targetFigure=lineargauge);

        @figure[progress](type=progressMeter; pos=300,150; size=300,20);
        @statistic[progress](source=signalSourceOutput; record=figure; targetFigure=progress);

        @figure[counter](type=counter; pos=300,250);
        @statistic[counter](source=signalSourceOutput; record=figure; targetFigure=counter);

        @figure[thermometer](type=thermometer; pos=700,50; size=50,300);
        @statistic[thermometer](source=signalSourceOutput; record=figure; targetFigure=thermometer);

        @figure[image](type=indexedImage; pos=240,280; size=16,16; images=status/off,status/green,status/red);
        @statistic[image](source=signalSourceOutput; record=figure; targetFigure=image); // note: indexedImage takes the value modulo the number of images

        @figure[plot](type=plot; pos=420,270; size=200,100);
        @statistic[plot](source=signalSourceOutput; record=figure; targetFigure=plot);

        signalSource.value = default(dropUnit(simTime()));

    submodules:
        signalSource: SignalSource {
            @display("p=50,350;is=s");
        }
}
This documentation is released under the Creative Commons license